U016 Application Logging with impulse

Attach, View Anaylze and Solve!

Application logging is essential for gaining insight into application performance and troubleshooting problems. It is not long ago that logging consisted mainly of a sequence of differently formatted prints, whose extension and standardization was application-specific. With logging libraries like Log4j, Log4c, etc, this situation was effectively improved. With Log4j 1 it was possible to create uniformly formatted text line logs defined by pattern formats such as "[%p] %r %c %M - %m%n". Standardized print interfaces simplified application development.

Text line logs

Text line based log formats are still very popular. Whether Log4j formats, syslog, Apache logs, CSV files or traditional logs, they are easy to read without a tool, at least up to a certain size.

The only requirement is a line ending, typically a line feed ('\n'), a carriage return ('\r'), or a carriage return followed immediately by a linefeed. The syntactic format of the lines and its content varies from format to format.

The impulse Pattern Log Reader enables the reading of any text lines with the help of regular expressions. The determined line segments can then be converted into textual and numerical data and stored as log samples. The impulse CSV Data and Log Reader assumes text lines with unique separator chars (configurable) and optional labels.

Log4j Pattern Layout [%p] %d %c %M - %m%n:

[TRACE] 2020-04-27 14:32:37,895 de.toem.impulse.test.secondary.Log2 log -  Calgary: detecting Calgary via BIOS EBDA area
[TRACE] 2020-04-27 14:32:37,897 de.toem.impulse.test.secondary.Log2 log -  fbcon: i915drmfb (fb0) is primary device
[TRACE] 2020-04-27 14:32:37,898 de.toem.impulse.test.secondary.Log2 log -  ata6: SATA link up 6.0 Gbps (SStatus 133 SControl 300)

RFC 5424

<135>1 2020-04-27T14:32:37.933+02:00 thomas log4j2.xml 11900 - - Bluetooth: SCO socket layer initialized 
<135>1 2020-04-27T14:32:37.934+02:00 thomas log4j2.xml 11900 - - get Sinus Wave 0.5590402518615227
<135>1 2020-04-27T14:32:37.935+02:00 thomas log4j2.xml 11900 - - hub 2-0:1.0: USB hub found

Markup Language Logs

Markup language logs are usually based on XML, JSON or YAML. They have the advantage of a unique structure and provide tools to create, validate and read these structures. They also have the benefit that they can easily be converted into data structures of various programming languages.

The disadvantage of these formats is that they cannot be read as easily without tools as text line logs.

Even if the markup languages formats have a uniform syntactical structure, the individual formats differ considerably. The Log4j 1.2 XML format consists of XML fragments, where the information is mostly embedded in attributes. The Java Logging API format consists of a complete XML structure; all information is embedded as text in child elements.

The configurable impulse XML Log Reader, impulse JSON Log Reader, and impulse YAML Log Reader allow reading all typical types of markup
language based log formats and are supplied with a number of standard configurations like GELF and Log4J.

Log4j JSON Layout:

, {
  "thread" : "main",
  "level" : "INFO",
  "loggerName" : "de.toem.impulse.test.primary.Log1",
  "message" : " ACPI: Local APIC address 0xfee00000",
  "endOfBatch" : false,
  "loggerFqcn" : "org.apache.logging.log4j.spi.AbstractLogger",
  "instant" : {
    "epochSecond" : 1587458274,
    "nanoOfSecond" : 900000000
  },
  "threadId" : 1,
  "threadPriority" : 5
}

Attach, View Analyze and Solve!

Attach your log sources

Read and combine multiple log sources from local resources or external networks, serial interfaces, data acquisition units and debug adapters. Use a highly configurable log reader that allows you to focus on the information you need and add your own data.

View and inspect

Trace problems back to their cause. See how your components work together, identify relationships and share the results with colleagues. Easy-to-use visualization elements enable the design of informative views.  Use a variety of diagram types to display log information or utilize charts to display statistical information.

Analyze

Quickly identify log patterns and errors without having to examine and read a single log file. A wide range of signal calculation tools make it possible to combine, compare and extract log information. Combine infomration from different sources, extract statistical informations or search for conflicts automatically. 

Solve

Analyze and fix the problem within the same IDE. Integrate the log view source port into your launcher and debug configuration. Compare the results with the Compare Viewer.

  • Pattern Logs

    Multiple pattern possible
    With the pattern log reader you can read line based logs that contain multiple line patterns. Using regular expressions, all relevant information can be extracted and written to one or more log signals. The reader is supplied with predefined Log4J configurations. A powerful UI helps to define and extend reader configurations.
  • XML Logs

    well-formed XML or XML fragments
    The XML Log Reader is a configurable log reader for all kinds of XML (Extensible Markup Language) based log formats and comes with pre-defined Log4J (1.2 and 2) and Java logging configurations. A powerful UI helps to define and extend reader configurations.
  • CSV Data and Logs

    the common data exchange format
    The CSV Data and Log Reader is a configurable reader for all typical kinds of CSV (Comma-Separated Values) based data and log formats. CSV is a common data exchange format that is widely supported by consumer, business, and scientific applications. With easy to use dialogs you can define configurations (separators, first line, labels, data types,...) for your specific formats. This article will help you configure and use the reader.
  • JSON Logs

    Supports multiple formats
    The JSON Log Reader is a configurable log reader for all kinds of JSON (JavaScript Object Notation) based log formats and comes with a pre-defined Log4J configuration. A powerful UI helps to define and extend reader configurations.
  • YAML Logs

    the simplified markup language
    The YAML Log Reader is a configurable log reader for all kinds of YAML (Yet Another Markup Language) based log formats and comes with a pre-defined Log4J configuration. A powerful UI helps to define and extend reader configurations.
H001 Beginners - How to open the viewer

There are multiple ways to view signal data with impulse. You might :

  • Use eclipse file resources :
    1. If no project exists existing, create a new project of any type (File->New->Project->??? );
    2. Import your record files (wave files, logs, traces,..) or drag and drop them into the project;
    3. Double-click the record file to open (or use the context menu of the file).
  • Use the File->Open File ... menu:
    1. Open the menu File->Open File ... ;
    2. Select the file to open;
    3. Press OK.
H002 Beginners - How to import example wave files

impulse come with a set a example wave files.

  1. If no project exists existing, create a new project of any type (File->New->Project->??? );
  2. Open the "Import..." menu (from "File"" menu or from the navigator context menu)
  3. Select "impulse";
  4. Select "Import example wave files";
  5. Select a project/folder as target.
H003 Beginners - How to save my changes

After receviing new signal data from a port or adding annotations, you may want to save your signal data changes.

  1. Open the "File" menu  and select "Save As..".
  2. Enter name, target folder and the file format.
  3. Press "OK"

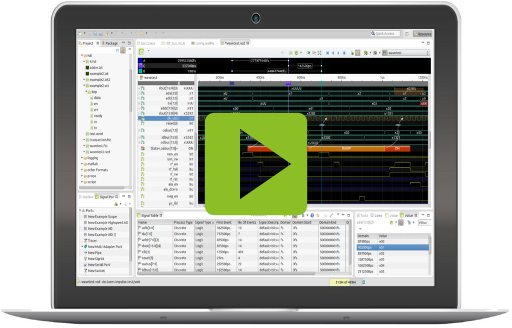
Screen Cast: U016 Application Logging with impulse

Adpat the reader to your needs

All readers have a powerful but easy to use UI. You can create configuration for custom text and markup language logs or modify included configurations for standard formats.

Change timestamp from date to relative time and back. Or use the index domain.
Combine different domain sources (e.g. attributes with seconds and nanoseconds)
Add custom attributes/values/elements.
Add multiple pattern for text line logs (supporting legacy logs).
Combine multiple log lines or elements into one log sample.
Adjust data types (text, enumeration, integer, float).
Read logs into single or multiple signals (e.g signal per source) using a flat or hierarchical structure.
Modifiy tag source and pattern.

Logs from file, over networks or tools

Logs are usually written to one or more files. More and more often, however, they come via a network interface (TCP,UDP,..), serial interfaces or debug adapters (embedded systems), as output of commands (e.g. 'cat /var/log', or as a combination of the previous options.

impulse signal ports can read the data directly from streams such as TCP, pipes, applications, interfaces or debug adapters. If more than one signal source is present (e.g., log data from a serial interface and trace over TCP), these signals can be merged and synchronized.

Views

A view combines a freely configurable set of plots organized in the form of a tree. Users can define multiple views and choose between them at any time to get the information they need.

Plots

Plots are easily configurable specific representations of signal data. Plots may have a common zoomable and scrollable axis (e.g. the time of the trace) or they may be adjusted into the window size (charts)

Sample Tables

Sample Tables allow tabular displays of signal data and are variously synchronizable with a main view (signals, cursor and data etc.).

Sample Instpector

The sample instpector provides a deeper insight into every sample.

Input Signal

The input signal is synchronized with the selection of the active viewer.

Position

The selected sample is synchronized with the cursor position of the active viewer.

Streams

Signal data in the case of streams (online data) are continuously refreshed.

Filter

Filters (text pattern or a value range) can be applied to all columns.

Combine

Multiple signals can be combined in one table.

Configurable Columns

All columns are configurable (style, alignment, format and visibility).

Analyze

It is impossible to visually analyse large amounts of data manually. Easy-to-use tools allow you to automate specific analysis applications.

Signal productions generate a new signal from a single log signal or multiple signals. They allow you to combine signals with mathematical operations, implement custom parsers, compare log signals, extract statistical information or automatically detect problems.

The resulting signal can then be displayed and analyzed in any chart or diagram. Here are some examples:

Extract line diagrams

Use the 'Value Extract' production to fetch numerical values from text content (or just extract a numerical member) and show it as line diagram.

Create log statistics

Use the 'SignalScript' production to extract relevant data from your log patterns and prepare the statistical data. Display with bar, pie, donut, radar, XY or user-defined charts. 

Detect Problems

Use the "Diff" or "SignalScript" production to identify problems and display them clearly in multiple views.

Compare

To compare 2 logs, select both files in the explorer/navigator and select "impulse->Compare with each other" in the context menu. The signal area of the viewer will show the following annotations.

  • Scope different: There are changes between 1st and 2nd record within this scope or a sub-scope.
  • Signal different: This signal differs between 1st and 2nd record.
  • Signal added: This is a new signal in 2nd record that is not available in the 1st record.
  • Signal removed: A signal in the 1st record is not available in the 2nd record.

In the display area, you can examine the differences by displaying either diff signals ( a diff signal only contains signal contents that are the same in both sources or shows an orange thick line in all areas with different contents) or the original signals.

Selected Resources

Logging and Tracing 1 - Basic pattern logs

impulse contains a rich set of tools and mechanisms to make complex systems visible and transparent.This series of articles shall give hints and ideas how to improve your systems visibility and to dig into.

Logging and Tracing 2 - Extract numerical data from text logs

In the first article we defined a pattern log configuration to read and extract given log data. As a result the reader was able to read the text and create signals with text information inside. Now assume that we have numerical data in this log to be extracted. The numerical shall be displayed as a line diagram.
toem

technical software and tooling

Company

Contact Us

This email address is being protected from spambots. You need JavaScript enabled to view it.