RN02 Eye Chart (NEBULA)
Outline
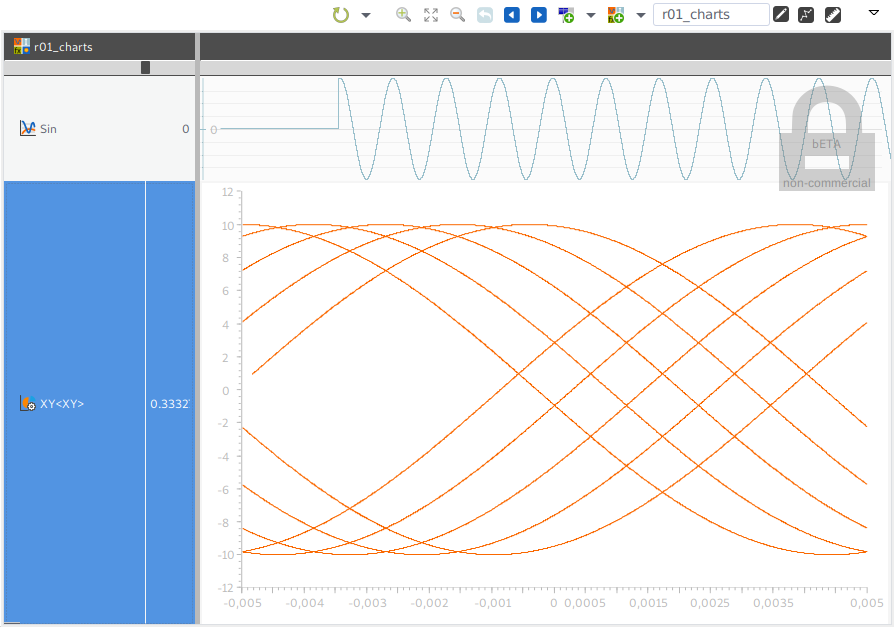
Nebula Visualization is a widgets library for data visualization in science, engineering and SCADA areas. An eye diagram is an oscilloscope display in which a digital signal is repeatedly sampled by a receiver and applied to the vertical input while the data rate is used to trigger the horizontal sweep.
| Platforms: |
|
|||
| Requirements: |
|
|||
| Known limitations: |
|
|||
| Status: |
|
|||
| Extensibility: |
|
|||
| Supported signal types: |
|
|||
| Chart Parameters: |
|
|||
| Plot Parameters: |
|
 32/64bit
 32/64bit
 32/64bit
Compatible signal data
The Eye chart provider supports simple numerical signals.
Chart Configuration
You can modify the chart behavior under Preferences->impulse->Charts.
- You may add own charts or chart variants
- Modify existing charts (Chart Parameters)
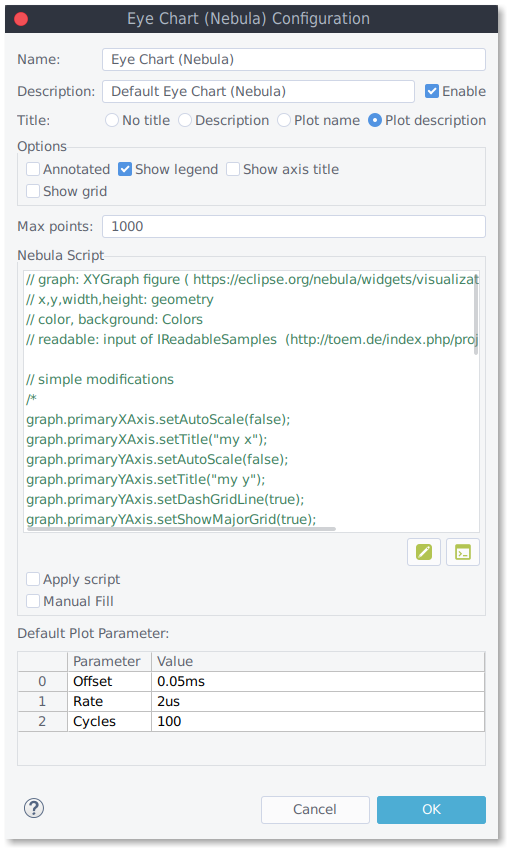
- Title: No Title, Description, Plot Name, Plot Description.
- Options: Annotated, Show Legend, Show Title, Show Grid.
- Max Points: Limits the maximum number of points to be displayed.
- Nebula Script: Extend the chart with Java Script.
- Apply Script: Enables/Disables the Nebula scripting.
- Manual Fill: Disables the provider's default signal processing; instead, the script must provide the display data.
You can extend the Eye chart using scripts. To achieve this you have access to the nebula graph object.
	// graph: XYGraph figure ( https://eclipse.org/nebula/widgets/visualization/visualization.php)
	// x,y,width,height: geometry
	// color, background: Colors
	// readable: input of IReadableSamples

	// simple modifications
	graph.primaryXAxis.setAutoScale(false);
	graph.primaryXAxis.setTitle("my x");
	graph.primaryYAxis.setAutoScale(false);
	graph.primaryYAxis.setTitle("my y");
	graph.primaryYAxis.setDashGridLine(true);
	graph.primaryYAxis.setShowMajorGrid(true);
If you check both "Apply script" and "Manual Fill", the script shall load the sample data into the chart (the standard data handling is disabled):
Beside the chart parameters, you can set the default plot parameters. You can override them in the actual plot.
Plot Configuration
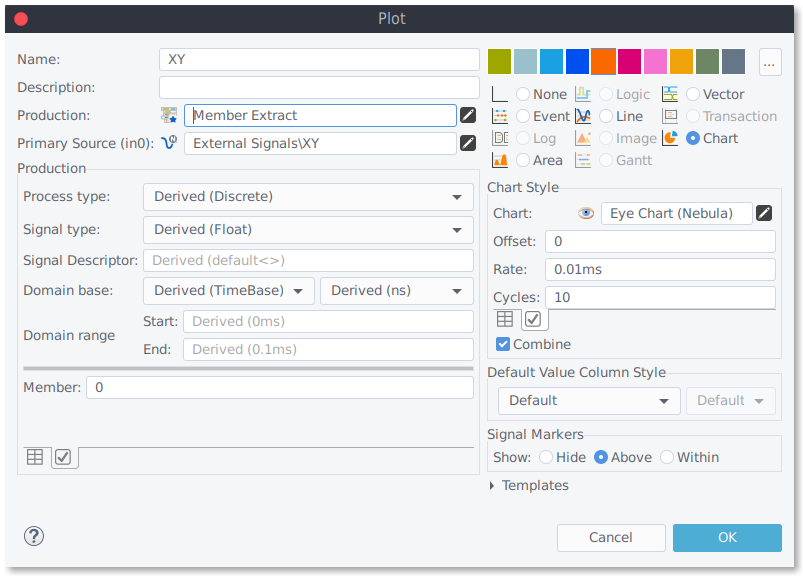
To display a chart in a given plot:
- Configure production/source to gain a compatible signal
- Set the plot type to "Chart",
- Configure the charts plot parameter ("Chart Style").
- Rate : Define the rate at which the eye chart is triggered (e.g. ' 10ms').
- Offset : Define an offset at which the eye chart starts (e.g. '1ms').
- Cycles : Cycles", "Define the (max) number of cycles.