RB03 Line Chart (BIRT)
Outline
BIRT is an open source technology platform used to create data visualizations and reports that can be embedded into rich client and web applications. A line graph is a graph that displays information as a series of data points connected by straight line segments.
| Platforms: |
|
|||
| Requirements: |
|
|||
| Known limitations: |
|
|||
| Status: |
|
|||
| Extensibility: |
|
|||
| Supported signal types: |
|
|||
| Chart Parameters: |
|
|||
| Plot Parameters: |
|
 32/64bit
 32/64bit
 32/64bit
Compatible signal data
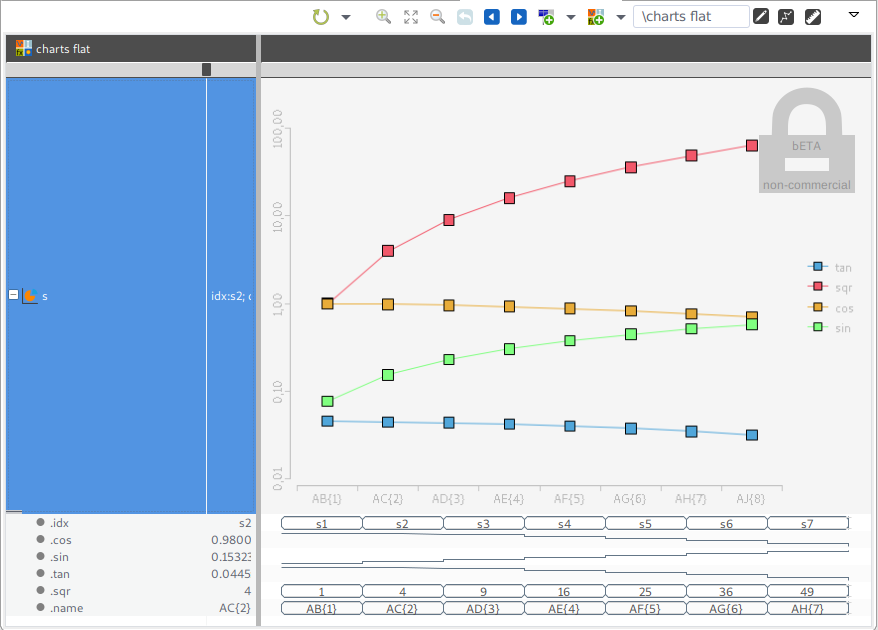
The BIRT chart provider accepts supports struct signals numerical arrays or simple numerical signals. Struct signals are usually the best choice for BIRT charts. The member names (of numerical members) represent the category values. An additional member with "label" content descriptor carries the sample label.
	idx;scr;cos;sin;tan;sqr;name
	0n;s1;0.9950041653;0.0768472383;0.0452583253;1;AB{1}
	1n;s2;0.9800665778;0.1532399835;0.044577974;4;AC{2}
	2n;s3;0.9553364891;0.2287264302;0.0434517013;9;AD{3}
	3n;s4;0.921060994;0.3028601333;0.0418908871;16;AE{4}
	4n;s5;0.8775825619;0.375202648;0.0399112879;25;AF{5}
	5n;s6;0.8253356149;0.4453261233;0.0375328647;36;AG{6}
	6n;s7;0.7648421873;0.5128158319;0.0347795671;49;AH{7}
	7n;s8;0.6967067093;0.5772726232;0.0316790777;64;AJ{8}
Chart Configuration
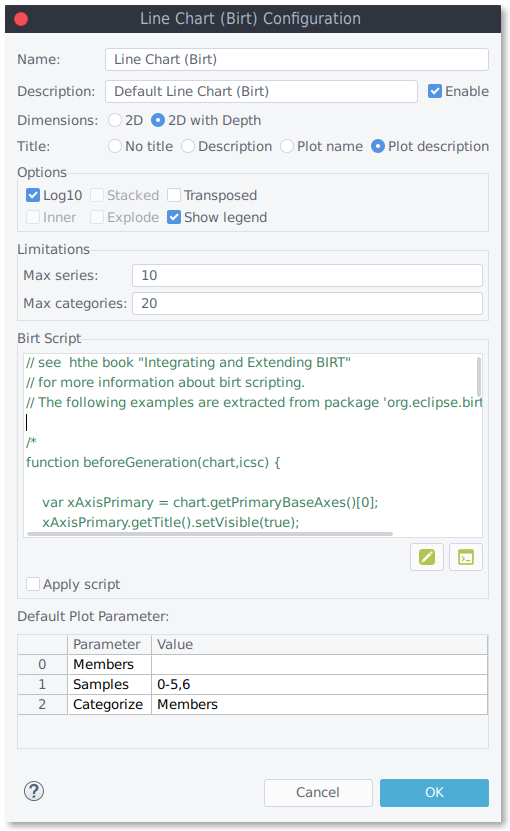
You can modify the chart behavior under Preferences->impulse->Charts.
- You may add own charts or chart variants
- Modify existing charts (Chart Parameters)
- Dimension: 2D, 2D with depth.
- Title: No Title, Description, Plot Name, Plot Description.
- Options: Log10, Transposed, Show Legend.
- Max series: Limits the maximum number of series.
- Max categories: Limits the maximum number of categories
- Birt Script: Extend the chart with scripting.
You can extend the Birt chart using scripts. The scripting API is defined here: Integrating and Extending BIRT. Beside the chart parameters, you can set the default plot parameters. You can override them in the actual plot.
Plot Configuration
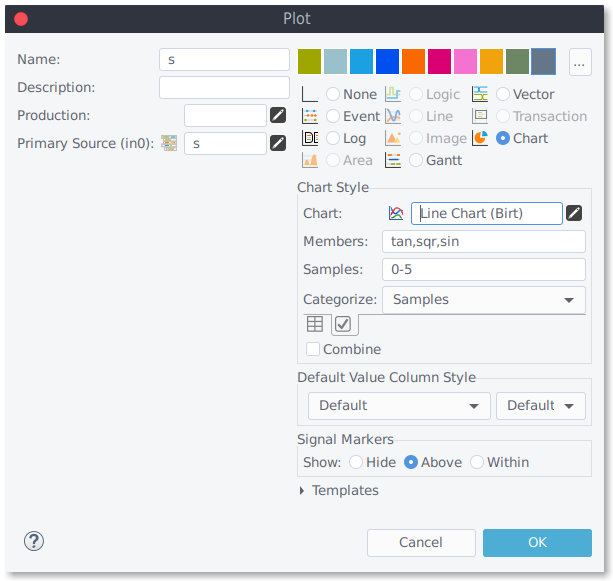
To display a chart in a given plot:
- Configure production/source to gain a compatible signal
- Set the plot type to "Chart",
- Configure the charts plot parameter ("Chart Style").
- Members : Identify the structure or array elements you want to display. Use a comma-separated list of all members, e.g.'X,Y'.
- Samples : Identify the samples you want to display. Use a comma-separated list of all sample indices, for example, '0,1,5-8'.
- Categorize (Members/Samples) : Choose if you want to categorize the members or the samples.
Signal script to define chart data
Use the following signal script example to prepare chart data using a struct signal. You may use a Signal Script Production or a recJs file.
  // members
  var members  = out.createMembers(7);
  out.createMember(members,0,"A",	ISample.STRUCT_TYPE_INTEGER,null,-1);
  out.createMember(members,1,"B",	ISample.STRUCT_TYPE_INTEGER,null,-1);
  out.createMember(members,2,"C",	ISample.STRUCT_TYPE_INTEGER,null,-1);
  out.createMember(members,3,"D",	ISample.STRUCT_TYPE_INTEGER,null,-1);
  out.createMember(members,4,"E",	ISample.STRUCT_TYPE_INTEGER,null,-1);
  out.createMember(members,5,"G",	ISample.STRUCT_TYPE_INTEGER,null,-1);
  out.createMember(members,6,"Label",	ISample.STRUCT_TYPE_TEXT,"label",-1);

  // Series 1
  members[0].setIntValue(12);
  members[1].setIntValue(12);
  members[2].setIntValue(12);
  members[3].setIntValue(12);
  members[4].setIntValue(12);
  members[5].setIntValue(12);
  members[6].setStringValue("Series 1");
  out.write(0,false,members);

  // Series 2
  members[0].setIntValue(14);
  members[1].setIntValue(15);
  members[2].setIntValue(16);
  members[3].setIntValue(17);
  members[4].setIntValue(18);
  members[5].setIntValue(19);
  members[6].setStringValue("Series 2");
  out.write(1,false,members);