U014 Embedded Systems
 The embedded
system’s complexity is growing constantly and high-level languages such as Java take up more
and more space in this area. impulse can help developers to improve the visibility
of what is going on inside.
The embedded
system’s complexity is growing constantly and high-level languages such as Java take up more
and more space in this area. impulse can help developers to improve the visibility
of what is going on inside.
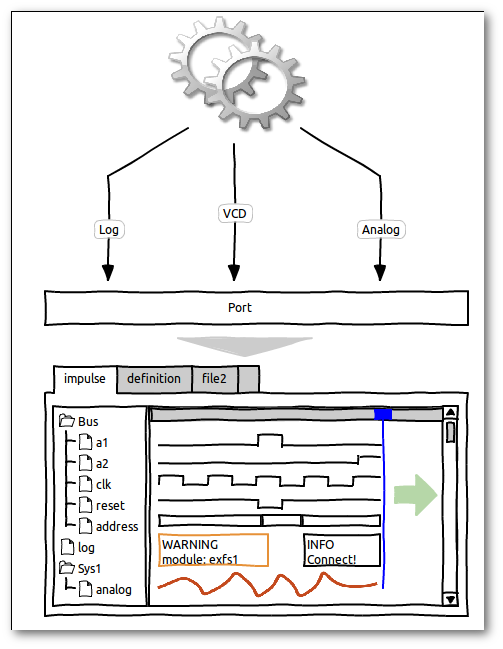
The embedded system’s complexity is growing constantly and high-level languages such as Java take up more and more space in this area. impulse can help developers to improve the visibility of what is going on inside. impulse allows developers to view signals and other information from multiple sources that are formatted in various ways — reading logic data from an analyser, fetching rtos infomration from the debug probe, parsing and visualizing log data from the serial line, showing line diagrams of analogue inputs, and presenting communication protocols grabbed from the Ethernet.
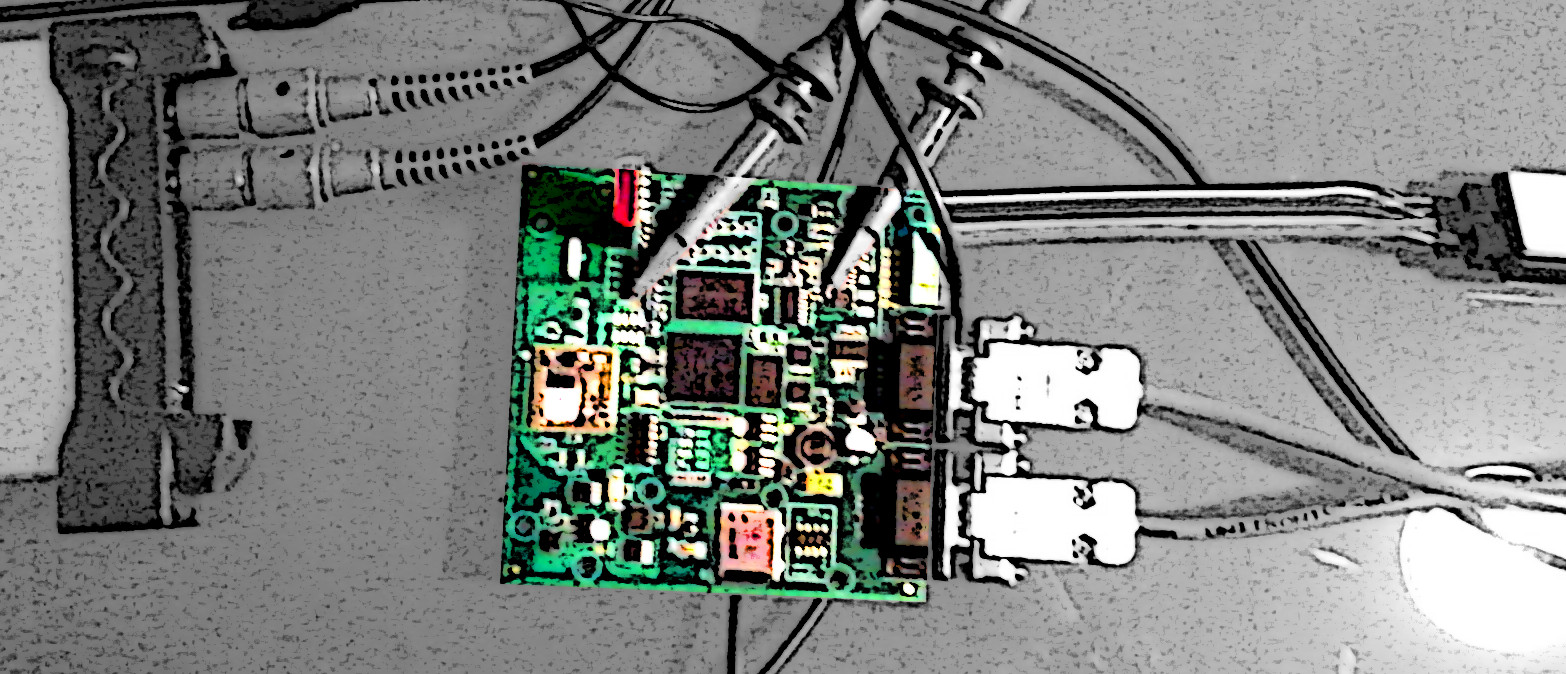
Connecting to a debug probe
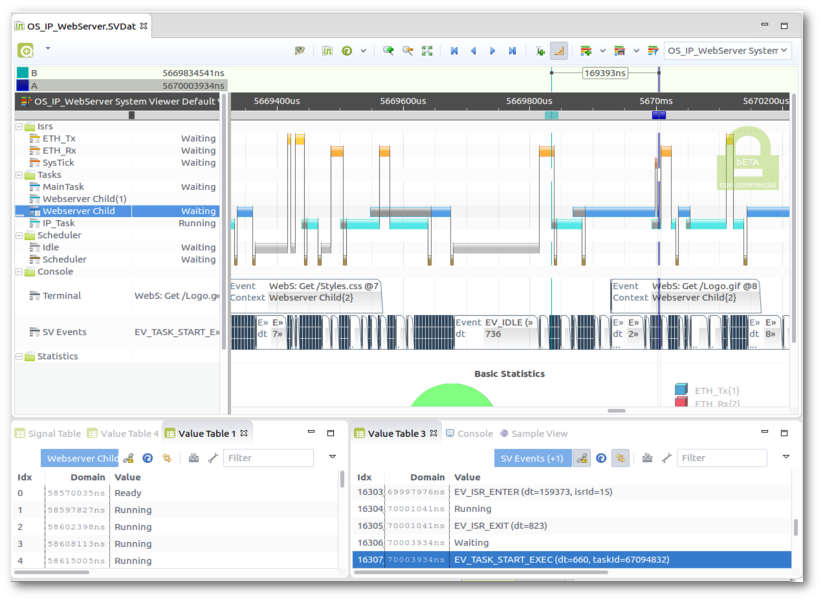
Read trace streams from your debug probe (e.g. SWO) or read and analyze contents of your memory.
You may use the TCP, Pipe or J-Link adapter to connect your debug probe. Analyze the trace data
with existing readers (flux, SWV, SystemView,...) or sketch your own reader.
impulse can
evaluate expressions (e.g. trace->buffer) to find memory locations (e.g. ring buffers) with
trace information. Memory content can be read and analyzed like any other source.
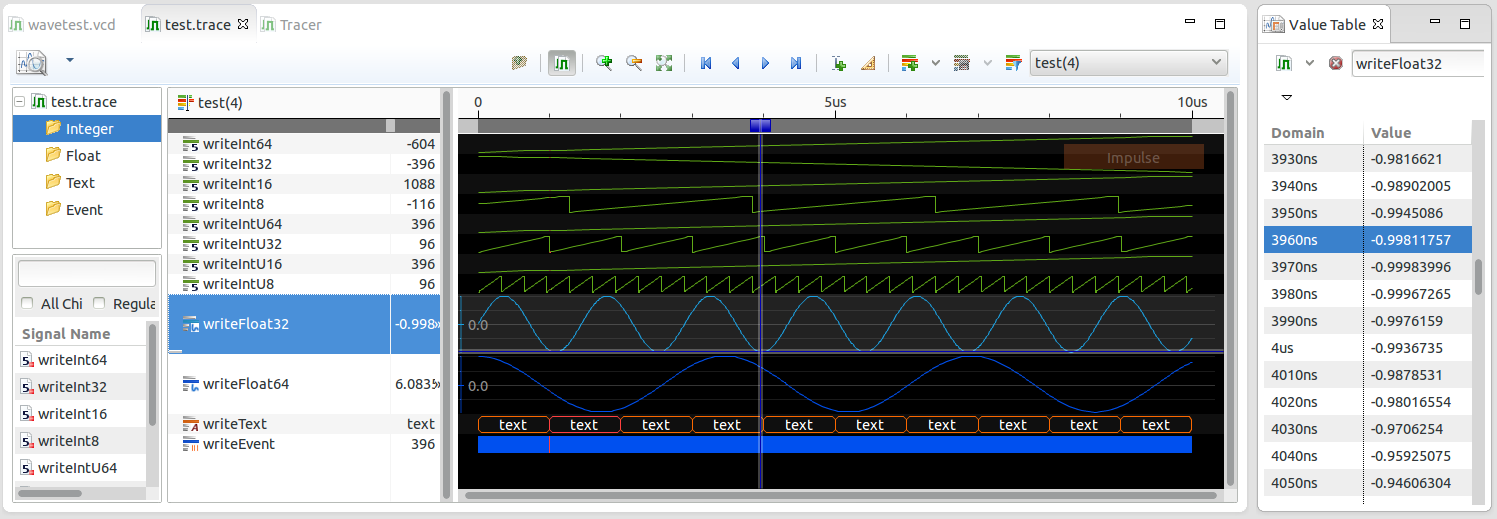
Analyse log data
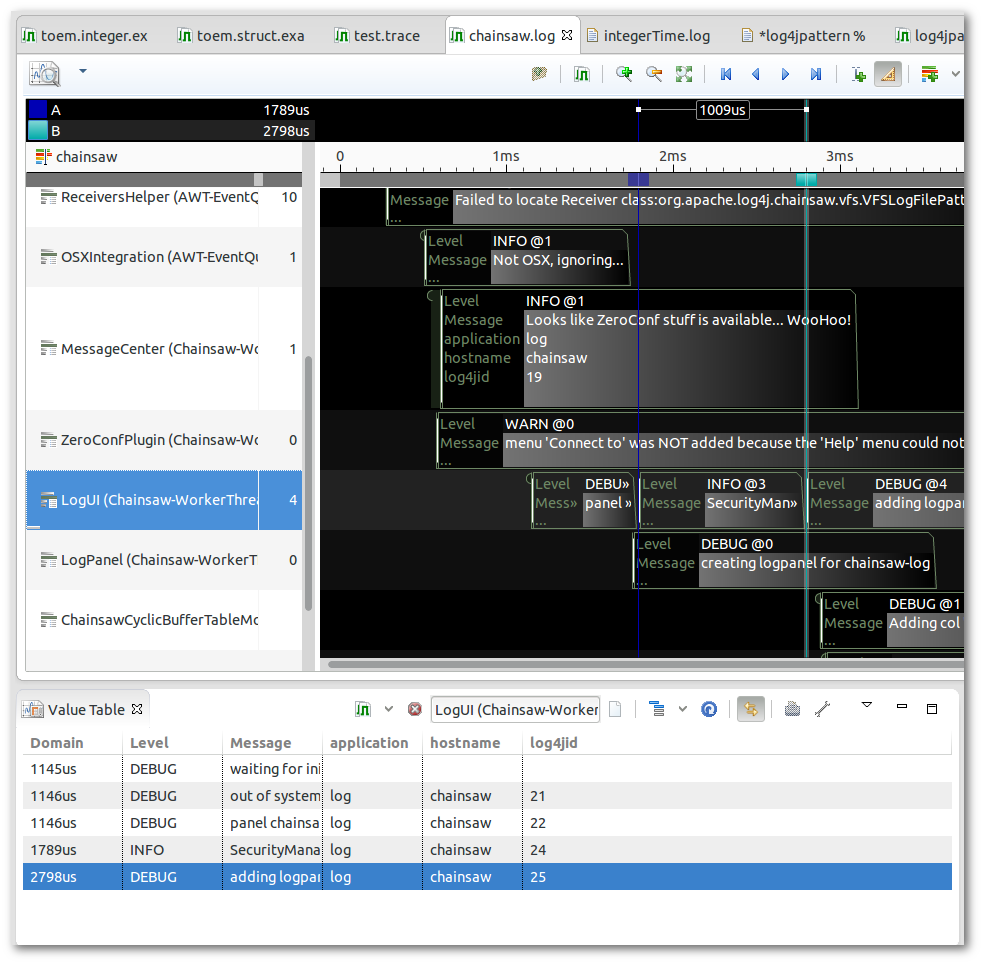
Logging is probably the most frequently used technique in debugging embedded systems. In most cases, log data are in form of text lines with columns of given value types and order (pattern log).
With impulse you can load any pattern log data from a file, a pipe or a serial interface and show them in line with signals of another type (analogue, digital, events,… ). See Using log files for more information. Beside simple pattern logs, Impulse also supports xml log files (log4j 1.2).
2014-02-21 15:18:08,173 FATAL [main] Main (Main.java:56) - Started X unresolved
2014-02-21 15:18:08,222 WARN  [main] Main (Main.java:52) - No more tuples
2014-02-21 15:18:08,235 INFO [main] Main (Main.java:54) - Started X2
2014-02-21 15:18:08,247 INFO [main] Main (Main.java:56) - Started X3
2014-02-21 15:18:08,296 INFO [main] Main (Main.java:52) - Started X4
2014-02-21 15:18:08,309 INFO [main] Main (Main.java:54) - Started X5
2014-02-21 15:18:08,321 INFO [main] Main (Main.java:56) - Started X6
Combine multiple sources
It's often the case that an embedded system has multiple outputs (e.g., log files, analogue data,… ). By using a Multi-Adapter Port, you can combine multiple sources into one. These sources can be streaming sources (pipes, sockets,… ) but also file resources, so you may combine multiple files into a single view.
Attach logic analysers and analogue acquisition devices
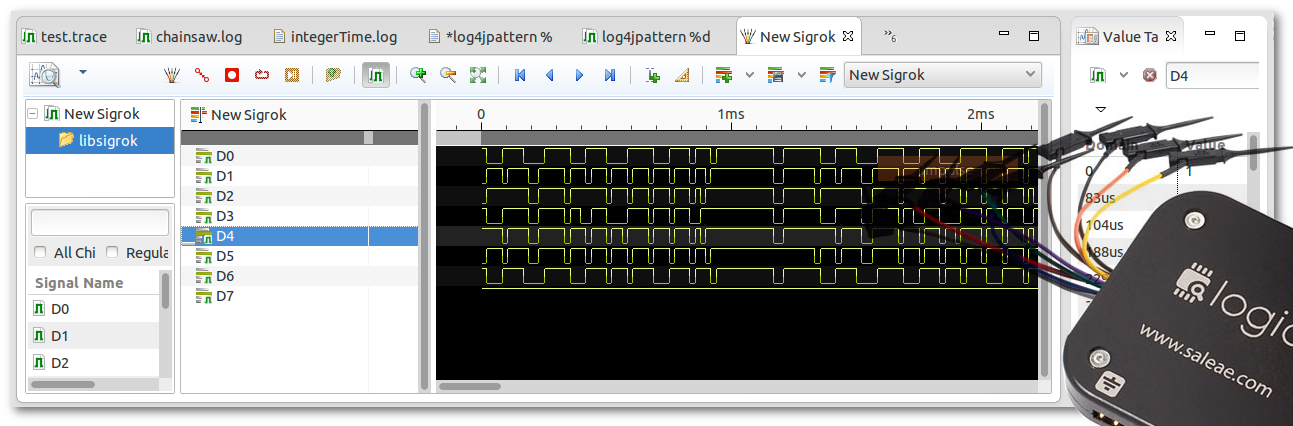
The sigrok project provides drivers to access various acquisition device types, such as logic analysers, MSOs, oscilloscopes, multimeters, LCR meters, sound level meters, thermometers, hygrometers, anemometers, light meters, energy meters, DAQs, dataloggers, function generators, RF receivers, spectrum analysers, power supplies and GPIB interfaces.
You will also find protocol decoders, like SPI, serial, USB,...
impulse contains an adapter to access sigrok by using the sigrok command-line interface. See Using the new Sigrok Adapter for more information.
Using the Serial Wire Viewer

The Serial Wire Viewer from ARM (Cortex-M microcontroller) provides non-intrusive real-time tracing. Usually this mechanism is used for 'print' only. The impulse SWV Tracer enhances SWV use-cases as it allows you to log and trace different kinds of data (real, integer, strings, logic) to be stored, visualized and analysed with impulse.See Using the SWV Tracer for how to get started.
  void itm_write_i8(unsigned char port, signed char b);
  void itm_write_i16(unsigned char port, short b);
  void itm_write_i32(unsigned char port, long b);
  void itm_write_i64(unsigned char port, long long b);
  void itm_write_f32(unsigned char port, float f);
  void itm_write_f64(unsigned char port, double f);
  void itm_write_t0(unsigned char port, const char* text);
  void itm_write_tn(unsigned char port, const char* text, char e);
  void itm_write_log(unsigned char port, unsigned char severity, const char* source, const char* message);
Using this simple API, you can write any kind of variables, logs and text, and visualize them as tables, line diagrams,...
Adopting the flux trace format
The flux trace format makes it simple to transfer your trace data into impulse. The format includes all required information, such as signal names, types and context, and is easily generated with the help of existing open-source trace emitters. It supports multi-core tracing (trace data from multiple cores can be merged), and can be used on any connection. See A3 Trace format to get the full information.
Implementing your own trace formats and attach to new hardware, communication interfaces or platforms
impulse uses the eclipse extension mechanism consistently. It is designed to be extensible in an easy way, and composed to be adaptable to different environments and use cases..
Implementing your own reader for a specific format is not a difficult job. What you need is some basic JS or Java knowledge and the following articles about extending impulse .

If you need further support or development services, just contact us. We are looking forward to supporting you in all technical areas.